Introduction
In this blog, we will discuss and capture network packet at different NSX-T capture points. Inside datacenter, there are 2 types of traffics (East-West and North-South) . We define intra Data center traffic as East-West traffic and Inbound/Outbound traffic from data center as North-South Traffic.
In NSX-T datacenter, we can apply capture at Edge node uplink interface to get North-South Traffic and at ESXI Hosts to capture East-West Traffic. During troubleshooting session, we apply packet capture and different point to fix issue.
NSX-T also provides troubleshooting tools like Trace flow and live traffic analysis to analyze traffic from NSX UI.
Topology Overview
Please refer below diagram to get high level understanding of environment.
We will initiate traffic from Admin PC (172.20.10.80) towards Web server (172.16.10.11) and will capture traffic at NSX-T Edge nodes and ESXI host.
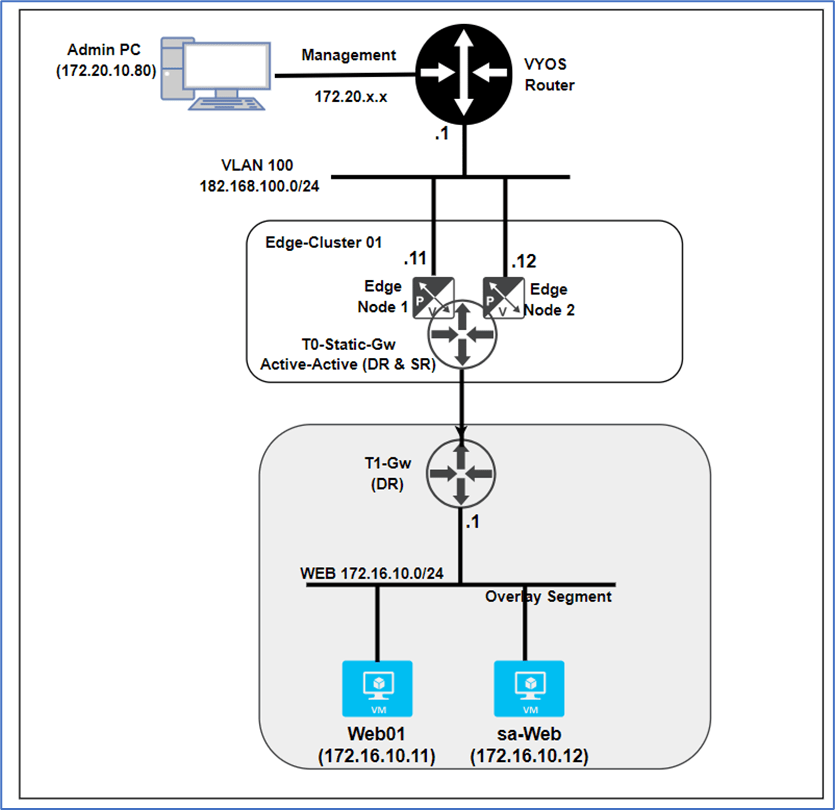
Figure 1 : Topology Overview
Below is High level traffic flow from Admin PC to Web server.
Admin PC >> VYOS Router >> Tier-0 Gateway >> Tier-1 Gateway (DR) >> Web server
Prerequisites
Connectivity between Admin PC(172.20.10.80) and Web server(172.16.10.11) is in place.
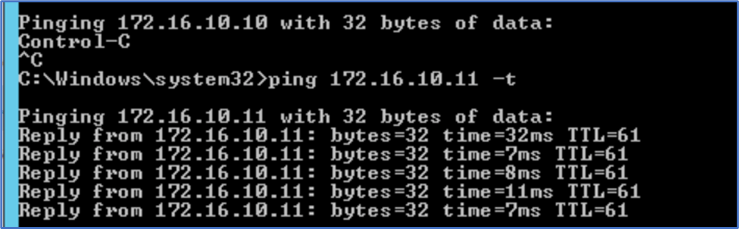
Figure 2 : Ping from Admin PC to Web Server
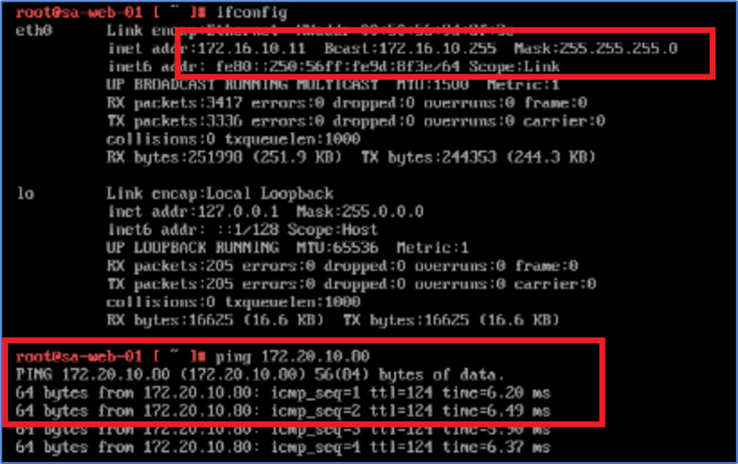
Figure 3: Ping from Web server to Admin PC
Packet Capture at NSX-T Edge
NSX-T Edge Node VM provides functionality to apply capture. We will apply capture at NSX-T Edge uplink interface on Active Edge Node. Edge Uplink interface gets created on NSX-T edge Service router.
In this Topology, we have NSX-Edge Node A is Active with uplink interface 192.168.100.11 in VLAN 100. To get Uplink Interface details we can use Edge Node CLI.
Please refer below to get uplink interface from NSX-T Edge CLI.
SSH to Edge Node and run command get logical-router and capture VRF of Service router. In our scenario VRF is 3.
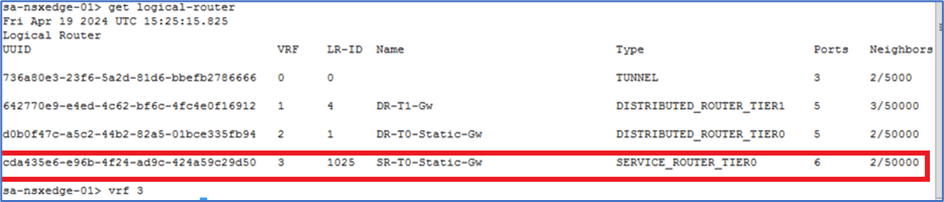
Figure 4 : Capture VRF details
Enter VRF number in NSX-T edge CLI to login into service router . In our scenario enter VRF 3.
Now enter commands get interface and find Interface ID of edge uplink. We will use this ID in capture command.
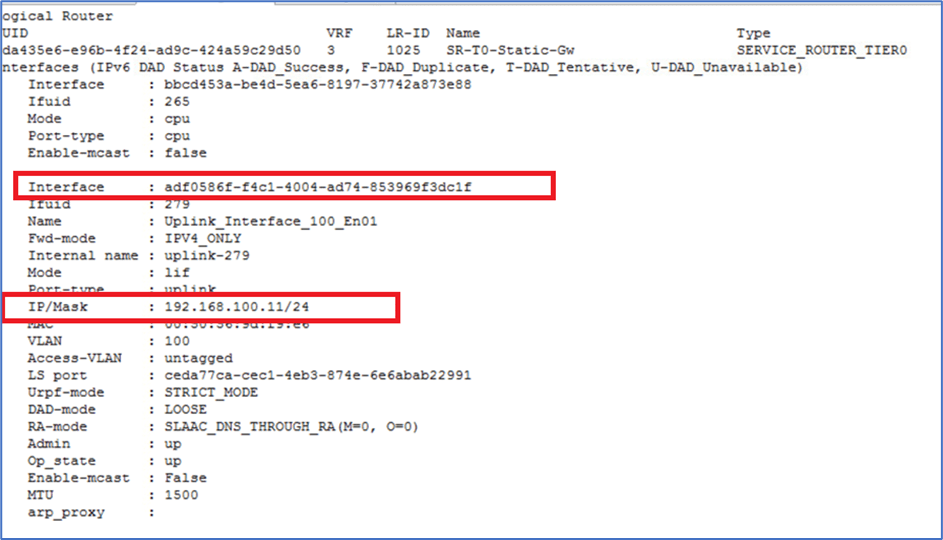
Figure 5 : capture Uplink interface ID
Now exit from Service router with command Exit.
NSX-T Edge Capture command
Please refer below template to apply capture at edge node.
Start capture interface <interface id > direction(optional) expression (optional)
Example
Start capture interface adf0454-sdhsd83-4003-aed3-sjduydf expression host 172.16.10.11
Above command will capture all traffic for IP 172.16.10.11.
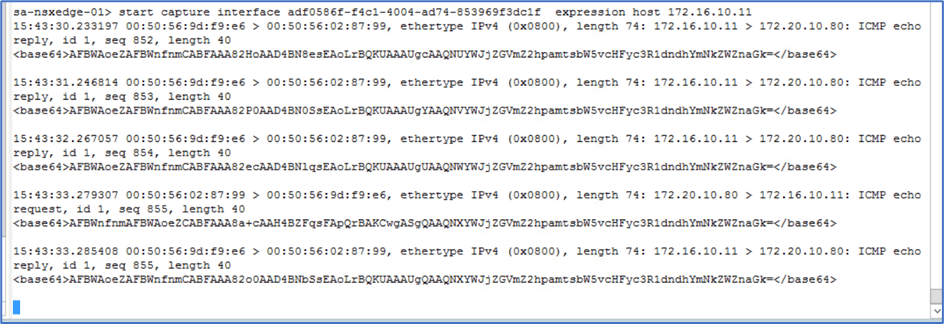
Figure 6 : Edge Node capture command.
We can also add port number to get more granular traffic like below.
Start capture interface adf0454-sdhsd83-4003-aed3-sjduydf expression host 172.16.10.11 and port 443
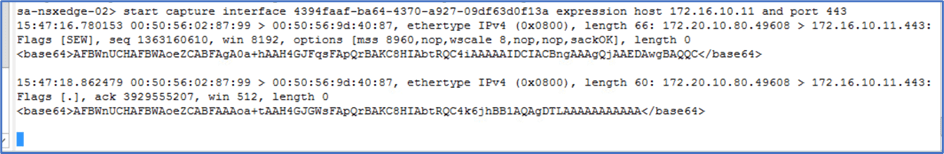
Figure 7 : Edge Node capture with Port.
Packet Capture at ESXI
We will use utility pktcap-uw to capture traffic and tcpdump-uw utility to analyze traffic at ESXI host. We can apply capture at multiple points inside esxi host but in this blog, we will use DV_filter to capture traffic.
To get all available option to apply capture use pktcap-uw – A at ESXI host.
DV Filter
DVfilter is an API framework that is available for VDS and require for NSX. During transport node preparation for NSX-T , additional kernel modules get installed in ESXI host. DVfilters are agents that reside between virtual machine and VDS. DVfilters inspect traffic to protect virtual machine from security attacks.
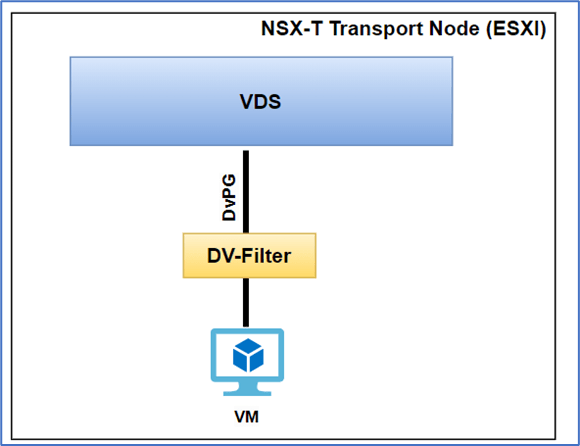
Figure 8 : DVfilter at ESXI
Note: We also use DVfilter to get Distributed firewall rules (DFW) to troubleshoot security incidents.
To apply capture , Identify ESXI host where VM is hosted and run command summarize-dvfilterin ESXI CLI. In our scenario, Web VM is hosted on ESXI02 and we are logged into ESXI via SSH.
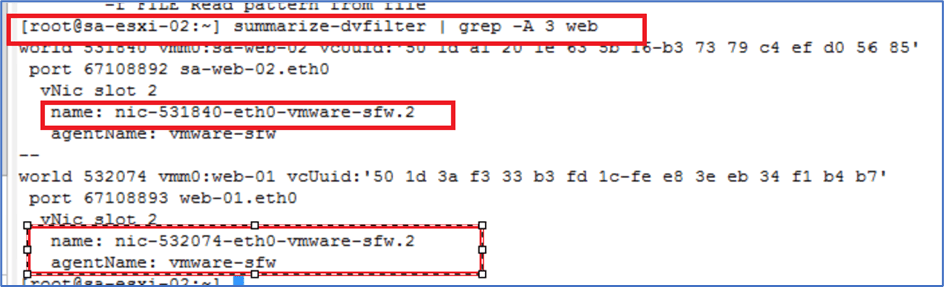
Figure 9: Capture DVfilter
In above screenshot, we provide additional input -A 3 web in command. -A N give number of trailing lines and web is keyword to filter VM name.
Note: We will use dv-filter for web-01.eth0 as we will ping vm web-01 from admin PC.
Now capture packet at ESXI Node with pktcap-uw utility. We can apply multiple parameters to get granular output like in below command we put capture before dvfilter.
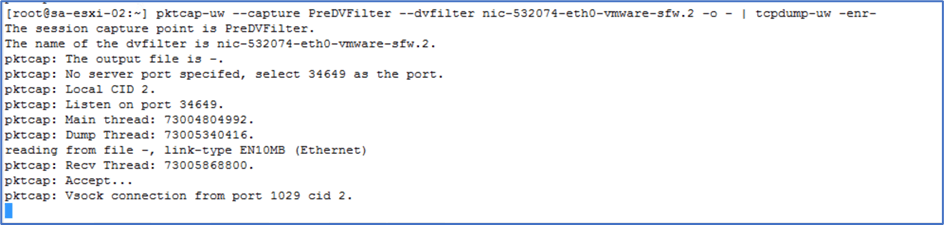
Figure 10 : pktcap-uw command
Now initiate ping from Admin PC towards Web server and check capture output.
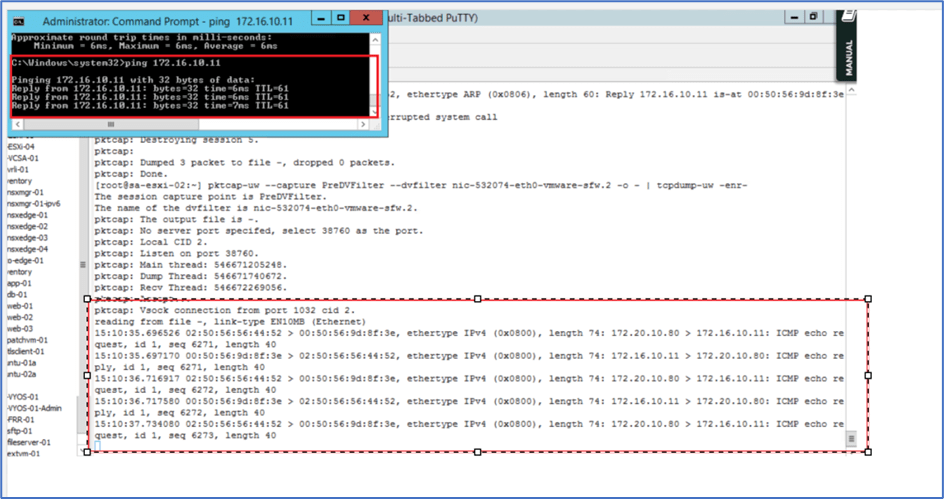
Figure 11: Capture at ESXI
Note: We can capture East-West Traffic by capture traffic at ESXI on both source and destination VM.
Conclusion
In this blog, we applied capture at NSX-T edge nodes and ESXI to get output instant on screen. We can also generate PCAP file from both capture points which can be used to detailed packet analysis with tools like wireshark. We will cover this option in next blog.


Leave a comment